Delivery Risk
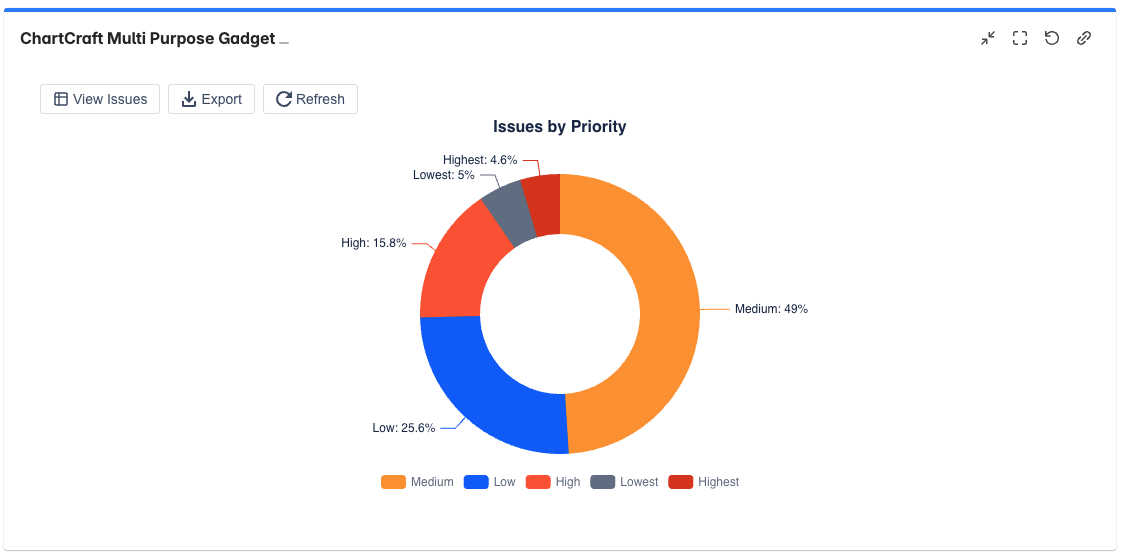
Stack status by priority to reveal where urgent work is getting stuck.
ChartCraft helps engineering managers, scrum masters, and delivery leads spot bottlenecks, visualize sprint health, and explain delivery risk without wrestling with raw Jira data.
Use stacked delivery views to see where urgent work is concentrated, where flow is uneven, and which issue types are driving reporting risk before a review meeting.
Instead of building charts from scratch, teams begin with templates designed for common delivery, flow, and executive reporting conversations.
Stack status by priority to reveal where urgent work is getting stuck.
Summarize issue mix and trend signals for leadership reviews in one dashboard gadget.
Use cycle time scatterplots and aging WIP views to detect work that is slowing down delivery.
Track commitment vs completion, scope change, and sprint progress without leaving Jira.
Surface delivery risk, workload imbalances, and throughput trends in a format leadership can trust.
Track sprint health, burndown, burnup, and bottlenecks without asking teams to maintain extra tooling.
Understand where work is aging, where flow is breaking down, and how priorities are affecting execution.
Turn saved filters into reusable, shareable reporting blocks for recurring reviews and dashboards.
Guided setup, recommendations, and templates reduce the time from install to first saved chart.
Go beyond basic counts with flow metrics, agile charts, story points, time tracking, and custom fields.
Use real Jira filters, boards, and sprints. Drill down into issues directly from the chart your team is reviewing.
Export images and CSV, copy configuration, and turn the same setup into repeatable dashboard views.
Start with Delivery Risk, Executive Summary, Flow Efficiency, or a sprint-focused preset.
Use a saved filter, Scrum board, or sprint to turn the template into a live delivery view.
Save the gadget, export the result, and refine the chart only when your team needs more detail.
Yes. Connect saved filters, boards, and sprints. ChartCraft also supports demo data for a frictionless first look.
No. The product is designed for engineering managers, scrum masters, delivery leads, PMO teams, and leadership stakeholders.
Yes. Beyond standard charts, you get bubble, heat map, tag cloud, cycle time scatterplot, aging WIP, CFD, velocity, burndown, and burnup.
The in-product wizard helps new users start fast, and the full setup guide is available in the public docs.
Install ChartCraft from the Atlassian Marketplace, or explore the docs first if you want to see how filters, templates, and advanced chart types work.